The Art and Science of Describing Images Part Two (W)
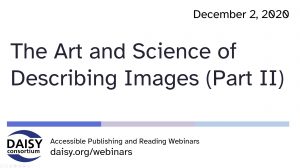 In our series of free weekly webinars December 2nd saw a session focused on image description: part two in the series entitled, The Art and Science of Describing Images. This webinar focused on more complex images than Part One, with speakers Huw Alexander and Valerie Morrison digging deeper into how we approach alt text and long description.
This page contains:
Full Video of the Webinar
Speakers
- Richard Orme, The DAISY Consortium—host and chair
- Valerie Morrison—Center for Inclusive Design and Innovation at Georgia Institute of Technology
- Huw Alexander—textBOX Digital
Session Overview
Huw Alexander opened this session giving us a brief resume of what the webinar will cover. The world has become driven by content especially in the digital space and, now more than ever, that content needs to be as accessible as possible. Over the last 10 years we have seen educational materials shift to a much more visual form of conveying information and society has followed suit. We need to be able to deliver this information so that it is accessible to everyone.
Valerie Morrison and Huw then took us through a series of complex image types, giving us an overview of how they tackle describing them and sharing with us their top tips for success. Valerie admitted that she still finds many types of images daunting, even with her years of experience but if you have the right approach you can break it down and keep it simple for the reader. Below are some of the main points for each image type which can be found in greater detail in the slide deck, together with some excellent examples.
Maps and Choropleths
Maps
- Always begin with a general overview giving a description of what the map is about
- If there’s an inset table this might be a good place to start
- Only describe items which are contextually important to the map
- Lists are useful in describing maps
- Don’t worry about colors (unless it’s a choropleth) or symbols which often don’t carry significance
Choropleths
These type of maps display quantitive values for distinct spatial regions using color. Consequently, they require a slightly different approach:
- Reference the title, the structure, the text key which may point to colors to measure the data, the scale and the trend analysis
- A political choropleth may also need dates, emphasis and context, places of interest, edge boundaries and a scale ratio
Timelines
- Create one general overview sentence
- Describe the range of the timeline
- List some of the details
Bar Charts
- Begin with the title and what the x and y axis denote
- Describe how the chart has been arranged and why. Sometimes bar charts are arranged to create a visual impact and this might require highlighting
- Describe each bar in regular, predictable ways
Supply and Demand Curves
- Begin again with the title and an x and y overview, remembering that this is just a graph!
- Describe the slopes and where they intersect
- Keep it simple. It’s easy to get lost in the “word salad” with this type of image
Complex Infographics
- Overview sentence should contain information on the basic parts of the infographic, the timeline and the illustrations it contains
- Work from the general to the specific, filling in the details as needed
- Make sure your description references: the title, the structure of the graphic, the information contained within each section, descriptions of the relevant images only, numbered list elements
- Do not describe decorative images
Tables
- Sometimes the tables are arranged specifically for sighted readers and you should sort the information out into more of a table to help readers process the amount of data.
- Complex STEM Infographics are very hard to parse and it’s much easier if you can convert them into tables with specific columns. An example of how making images available in multiple modalities can help reach more learners eg. a dyslexic reader would benefit from this specific approach.
- Consider adding structural alt text to your tables. This gives the reader an head start in understanding how the table is organized and allows them to create a mental map before they process the information that it contains.
Before taking questions, Huw ended the session by reminding us:
You are trying to recreate the image and it’s impact for the reader. To do this you need to unravel the complexity it may involve and create a level playing field for all users.
Related Resources
- PowerPoint slide deck
- Full transcript Word document
- The Art and Science of Describing Images Part One: Overview and Resources


 A few weeks ago The DAISY Consortium ran a
  In our series of